

Early Warning System
The EWS is an investment and security research subscription service designed for both retail investors and finance professionals.

Early Warning System - Introductory Video- Daniel Want, Chief Investment Officer
Early Warning System (EWS)
EWS: Independent Insights for Smarter Investing
The EWS provides both finance professionals and retails investors with expert, unbiased security research and market analysis. Get contextual conditions insights, regular updates, and regular video analyses – all in one place.
Gain access to:
Big Money Buying/Selling information + Proprietary Analysis Tools including Capital Flow datasets (between countries, asset classes and into/out of individual securities)
S&P 1500 stocks, ASX 200 stocks, with an expanding global equities universe every month
Global Equities, Fixed Income, Commodities, Currencies, Crypto and major global Gold related equities
regular VIDEO updates to keep you on top of what’s happening (where the opportunities and risks are shaping up in global markets and individual equities)
Three tiers of subscription depending upon how comprehensive your investment insight needs are.
Stay informed and invest with confidence. Put the odds in your favour.
What is ‘Early Warning System’ (EWS)
PCM’s ‘Early Warning System’ is a quick and easy way to find possible medium to longer term investment opportunities by tracking what big money is doing in any given market; whether they are buying or selling.
There is nothing more frustrating than missing an opportunity to make money - the EWS allows you to consider opportunities and what could be setting up before the crowd catches on.
Who is it for? Medium to longer term investors;
Anyone that just wants a better overall context to make their own investment decisions. (Or this is fantastic context for you to be more empowered in your discussions with your financial advisors.)
Financial Advisors (accountants, financial planners, stockbrokers, etc) who want to easily review the investment holdings of their clients, being alerted slightly ahead of time as to when they should be having conversations with clients about specific investments… making them more valuable to their clients, building deeper relationships and generating new leads.
Gain access to all ASX 200 stocks in addition to the major global Gold related stocks and gain insight through our fortnightly update VIDEOS.
How does it work? In over 25 years of studying markets, we found the most efficient way to identify opportunities slightly ahead of time was to see what ‘Big Money’ is doing and to consider also doing likewise.
Why? The Biggest Money participants in the world (large institutional investors, large ultra-high net worth families, sovereign wealth funds, endowments, etc);
have better access to information – they have the resources and the high-level connections to have closer proximity to information that actually matters, usually accessing this ahead of time.
they are so big that they need to act slightly ahead of time so they can buy before the market (or stock price) starts to go up, usually while there is a lot of bad news out there about the stock or market. If they buy when the market is going up the size of their buying will push the market higher (against them) meaning they’ll miss the opportunity to buy cheaply.
Opportunity: ‘Big Money’ leaves footprints in the markets. We have learned to triangulate what they are doing using only the basic data that any given stock or futures exchange publishes.
For example; look at when big money was buying one of Australia’s largest stocks, the CBA…

You can see that over the last 30+ years (see yellow highlights), that when the Big Money were buying they were often some of the best times to have bought the stock.
If we ‘zoom in’ to the last 16 years, we can see that often they’re early but on a multi-year time horizon, they are often well rewarded for buying when no one else is interested in the stock…

‘Big Money’ tends to buy when they see value, that is, when price is trading below what they believe to be an appropriate valuation for the company or market.
Does ‘Big Money’ always get it right? Not necessarily. Sometimes they are VERY early, which means they appear to be wrong for many years. They simply are buying and holding what is ‘valuable’ for as long as it remains valuable in their view (in light of the information they have access to).
Big money tends to have a focus on the longer term. They are happy to be patient and to hold something if they know it’s likely to prove successful.
Microsoft is a good example… it traded sideways for ten years (see yellow highlight), all the while Big Money was buying strongly, before it went up in price more than 15 times what it traded for on average during that decade.

Yet you can also see in the Microsoft example above, that there were times when Big Money was buying and price went up shortly thereafter (see the end of 1988, or 1993 & 2022 for example).
Being able to see when Big Money are buying or selling a stock is extremely helpful, and can alert you ahead of time as to when you should perhaps be doing a little more research on the stock (to consider whether you too should be buying, holding or selling).
Sometimes it might appear like Big Money are getting it wrong, like in the Telstra example below…
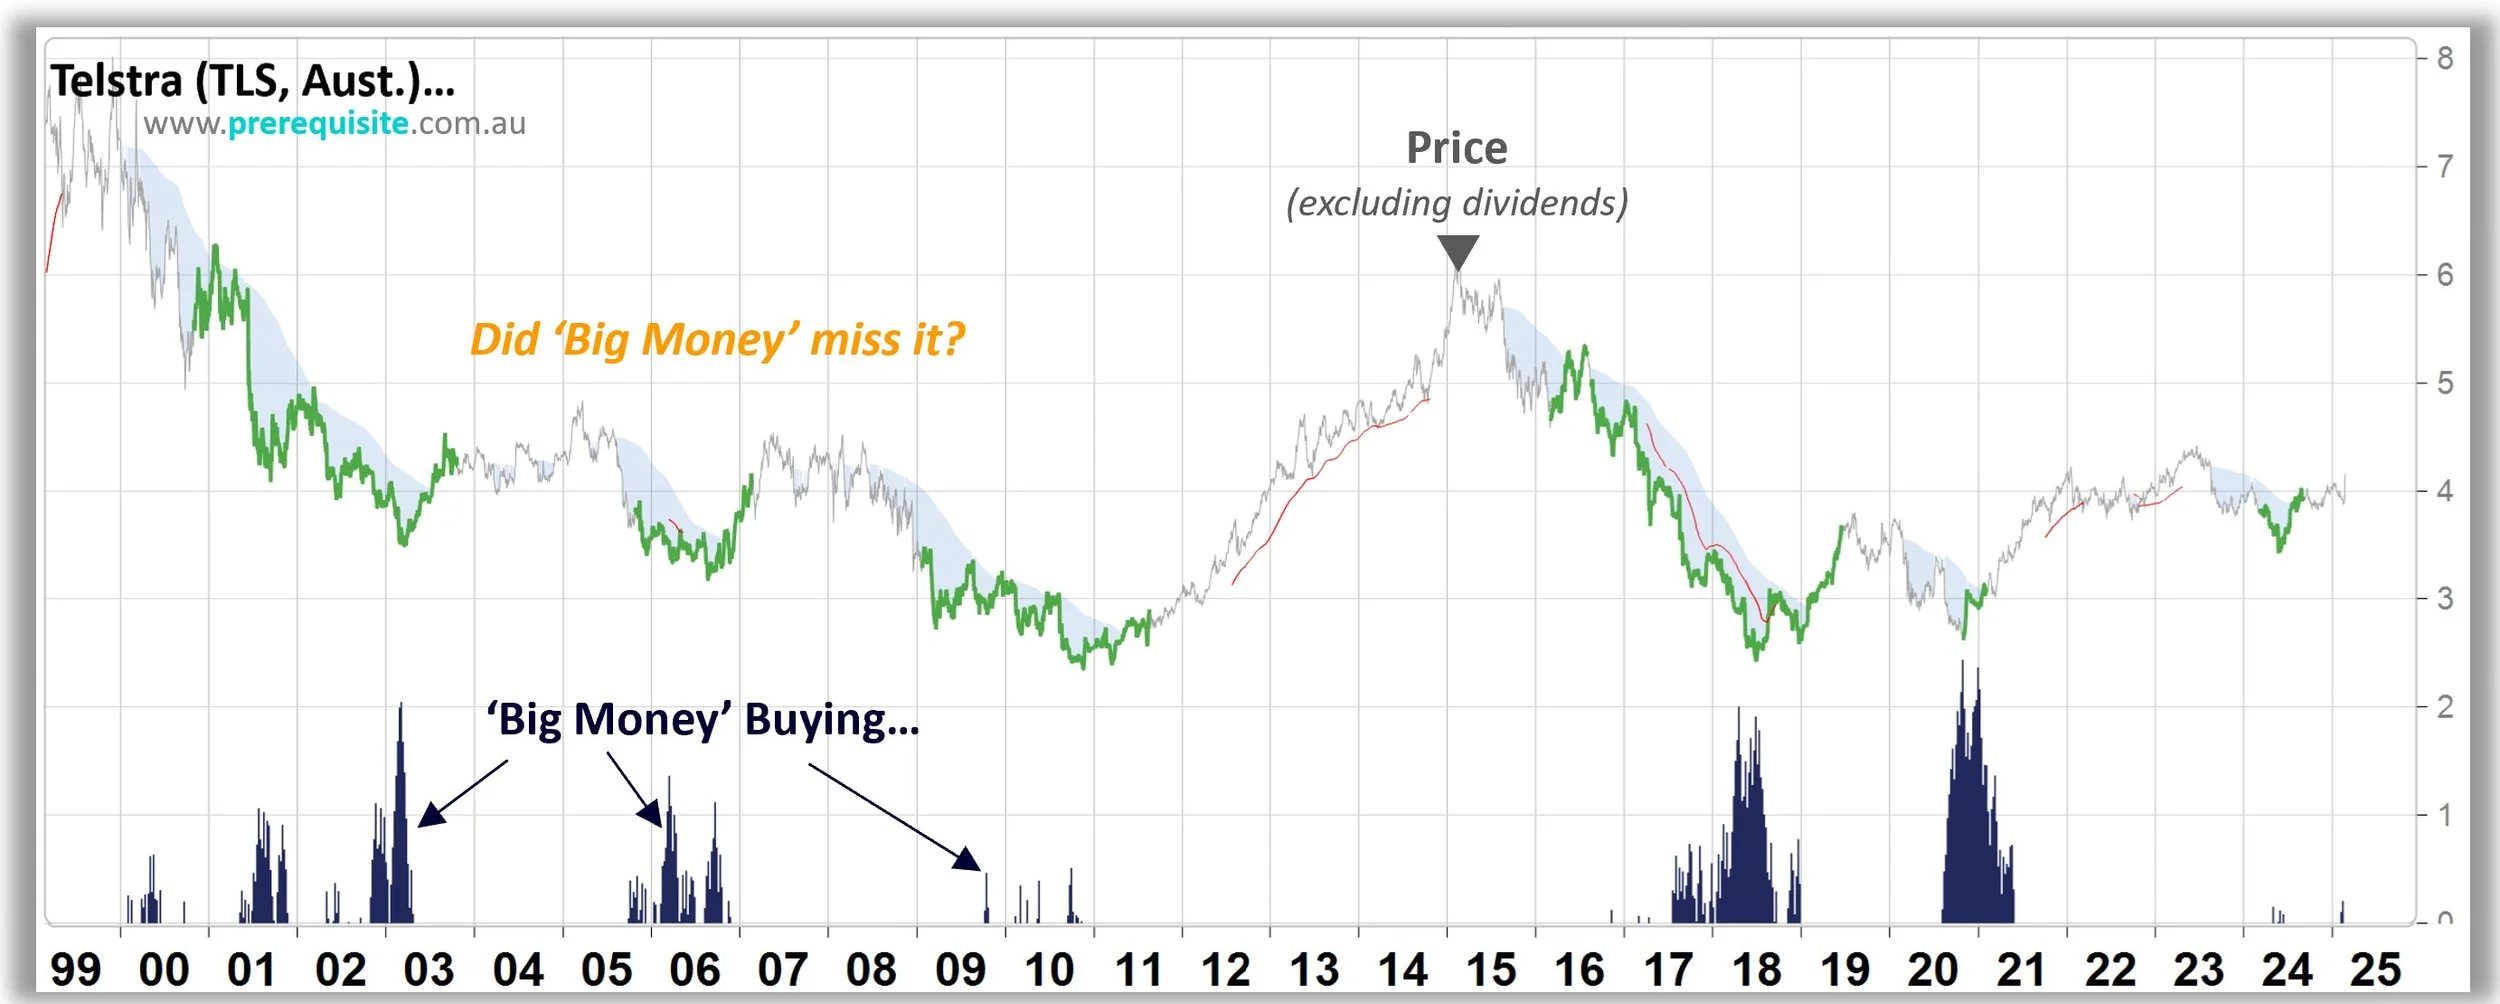
But when you factor in dividends, the total return of the stock (with dividends paid and reinvested) shown below in orange helps to show the logic in the Big Money buying…

Now, seeing what ‘Big Money’ is doing is an excellent (but not perfect) ‘Early Warning System’ – it can help you to follow what might be happening with a stock you are interested in, and provide a possible ‘Early Warning’ as to whether you should be doing further research to consider buying, holding or selling the stock.
PCM’s proprietary insights on fundamentals, liquidity and probable institutional activity can be used on any large security with publicly available volume and price data.
The Early Warning System narrows in on three key things.
Are the fundamentals improving or deteriorating?
What is well informed, large patient capital doing, buying or selling?
Are liquidity and capital flows strong or weakening?
Our EWS tracks these signals in a simple, easy to understand way so you can move forward with confidence.
The Best Opportunities:
What does this look like?
Here is a chart of the Commonwealth Bank of Australia going back 30 years, it has three simple components:
Price studies in the top panel – watch for when it turns ‘green’.
Big money buying or selling in the middle – watch for when buying becomes ‘high’
The Fundamental Conditions Index at the bottom – watch when it starts to improve from a stressed state.
Get these three things happening together (as shown by the yellow highlights) and you have an ‘early warning’ of a possible opportunity. Meaning it is time to do some further investigation to see if you should possibly be buying this stock.

Our framework is designed to provide early warnings about possible market trends or opportunities, it is not designed to provide specific buying or selling actions as your risk and portfolio management strategy will determine this.
When you have Big Money Buying, and stressed Fundamental Conditions, it’s usually an early sign of possible opportunity – especially when you start to see price starting to make higher lows.
There is nothing more frustrating than missing an opportunity to make money - the Early Warning System allows you to consider opportunities and what could be setting up before the crowd catches on.
Introducing the ‘Storm Warning’…
The Storm Warning indicator is shown as a blue cloud that appears over price on the below chart (think of it like the stock being weighed down and ‘under water’ by issues that are plaguing the company’s prospects).
Whilst ever the ‘Storm Warning’ is in effect, it means that you really need to be doing your research if you choose to hold this security. Big Money are well-diversified and can from time to time get caught out, it is still a complex world out there.
And when we add in ‘Big Money’ selling, in addition to an objective ‘Fundamental Conditions Index’ (shown below), we can see that when fundamental conditions are deteriorating and we’ve had Big Money selling recently, the prospects for the stock aren’t great…
An example was Gold in 2011 (see below chart)…
A. Red line appearing means liquidity issues are starting to build in the market, if the redline is tested and fails, then a dangerous situation could ensue
B. Presence of Big money selling – institutions were harvesting gains and getting out
C. Fundamentals finally deteriorating even though price is making new highs in 2011
D. Storm warnings started to appear in 2012 & 2013 with last red line level being taken out
Price went down for next four years.

Breaking dependencies on the Institutions:
In designing the Early Warning System, we wanted the following attributes to be present:
We wanted to easily & quickly see what Big Money was doing, buying or selling – and we wanted to be able to see whether Fundamental expectations for the stock were improving or deteriorating.
We wanted to be able to see this for any stock in the world, or any exchange traded market
We wanted to be able to do so cheaply, without being held hostage to institutions with unique or proprietary datasets that they may not always publish (we also didn’t want to be held hostage to government entities like the CFTC to publish datasets)
We wanted to be able to compare any market in the world on a like for like basis (a consistent framework)
We wanted to be able to see extensive historical experience, how has this framework done since the stock (or market) started trading? We can better understand behaviours and historical precedents.
We wanted an Early Warning System to alert us to where opportunity or risk might be slightly ahead of time, this will tell us where we should do more research (it is not a ‘decision making system’ that tells us what to buy or sell, when and how much).
Just because big money moves or is buying, it doesn’t necessarily mean it’s a sound investment, they operate usually to longer-term time horizons for their decision making and they also can get things wrong (the global system is complex and often chaotic after all) – this is why big money also uses risk management and portfolio balancing techniques… you too need a risk and portfolio management strategy.
Trying to mimic the actions of big money whilst not having a full understanding of why those investors made those moves in the first place can also prove problematic. Our tools simply suggest that big money activity is likely happening, and whether that activity is buying or selling – what we can’t tell is why they are doing so; are they harvesting gains? Are they following a systematic rebalancing program? How big a position size does such buying really represent in their broader portfolio? What other exposures might they also be offsetting this exposure with? Etc.
This is why we view this simply as an ‘Early Warning System’ and not necessarily a ‘Decision Making System’. No approach is perfect, but we do consider our EWS framework as a ‘least bad’ approach …we would not want to operate in markets without the insights generated from this EWS approach.
The EWS framework is designed to supplement and enhance your existing strategy by giving you an extra layer of information that may at times help you to make smarter and more timely decisions whilst still relying on your core knowledge and strategy.
How do we track “Big Money”?
We developed a Patient Money Tool (i.e. the tool that shows us whether ‘Big Money’ is buying or selling) that triangulates Big Money behaviours synthetically only using price and volume datasets that any stock exchange in the world will publish.
Although we don’t have the actual purchase receipts of big money activity, what we do have is an ability to triangulate their collective activity (their collective behaviours) using the basic data that any given stock or futures exchange publishes.
We studied the behaviours of Big Money in all markets in order to learn how to extract the evidence of their buying or selling in a market, and present it in a manner that is simple and easy to understand.
In practice big institutions make trades both on the exchange and also behind the scenes (or off-exchange, in over the counter transactions [OTC] or dark pools). Our methodology utilises a process of triangulation to identify when big money are active in an exchange traded market – our research suggests that OTC and dark pool transactions tend to still reconcile into exchange traded markets through arbitrage opportunities that present to keep the different trading arena’s reconciled and in parity with each other. When we study big ticket dark pool trades for S&P 500 stocks we find our Patient Money Tool accounts for dark pool activity extremely well.
How do we track “Fundamentals”?
We also learned how to extract the fundamental expectations pricing assumptions from markets and display it in the form of our Fundamental Conditions Index. This helps us to see whether the market thinks the fundamental prospects for the company or market are improving or worsening, also being able to easily compare this to historical pricing conditions or other unrelated markets.
When the Fundamental Conditions Index is in ‘stressed’ territory, before buying the company, your research process should assess whether the down cycle in the company’s performance is due to cyclical or ‘temporary’ factors (which imply the fortunes of the company are likely to rebound again), or whether the downturn is ‘terminal’ where the prospects for the future of the business have become impaired for some reason. Typically you only want to ‘buy’ temporary downturns, where there’s evidence of big money buying and the Fundamental Conditions Index (confirmed by price) is starting to improve again.
For further information on these tools, please watch the 58 minute VIDEO at the bottom of this webpage.
Capital Flows Analysis
Another of our big breakthroughs is the ability to model capital flows, or the movement of money in and around the system.
The ability to see whether capital is concentrating into a stock (or dispersing away from it) is extremely valuable – so is seeing how optimistic or negative the Speculative Money flows are towards the stock.
Capital flows are the cause, valuations are the effect. Capital flows are primarily what drive stocks, valuations are a secondary consideration.
In the months to come, we will also include the capital flow information for each stock.
Below is what it looks like for Microsoft, but as it’s an advanced form of analysis, it does require some training to be able to get the most out of the information (we provide a library of training Videos when you sign up).

Gain access to:
Big Money Buying/Selling information + Proprietary Analysis Tools including Capital Flow datasets (between countries, asset classes and into/out of individual securities)
S&P 1500 stocks, ASX 200 stocks, with an expanding global equities universe every month
Global Equities, Fixed Income, Commodities, Currencies, Crypto and major global Gold related equities
regular VIDEO updates to keep you on top of what’s happening (where the opportunities and risks are shaping up in global markets and individual equities)
Three tiers of subscription depending upon how comprehensive your investment insight needs are.
Stay informed and invest with confidence. Put the odds in your favour.
A Deeper Understanding of the Tools & Where They Come From:
Please view the 60 minute Video below for a more advanced discussion of our Early Warning System tools and approach…
[Timestamps] Content
[00 minutes] General Intro:
Background on the development of our Tools
[02 minutes] Who are the ‘Big Money’ Participants?
Who are they, why should we track them and how do we track their buying and selling activity? What are their strengths and weaknesses?
[13 minutes] How do we account for Institutional ‘Off-Exchange’ trading?
Often ‘Big Money’ participants use ‘dark pools’ or other Over The Counter (OTC) venues to do their trading, how do our Tools deal with this issue and capture ‘Off-exchange’ activities?
[17 minutes] How do our Tools capture the activities of Commercial Insiders?
[20 minutes] How do our Tools capture the activities of Dealers & Market Maker Positioning?
[22 minutes] How do our Tools capture the activities of Corporate Insiders (CEO’s & CFO’s)?
[23 minutes] About our Speculative 'Hot Money’ Flows Tool
[24 minutes] How do our Tools capture the activities of Central Banks?
[25 minutes] How we measure Liquidity (Order Book Depth) & Net CAPITAL FLOWS
Not just for currencies, but also can be applied to stocks, bonds, commodities & crypto!
[31 minutes] How we can assess the Fundamental Health of a Company (or market) in less than 5 seconds.
Our Capital Markets derived ‘Credit Risk Model’ that can be applied to any stock or market.
[34 minutes] What our Early Warning System looks like with practical examples:
The Commonwealth Bank of Australia (CBA, ASX)
The S&P 500 Index (USA) - including a discussion how capital flows (cause) drive valuations (the effect).
Gold (in USDs)
US Treasury Bonds (10yr)
US Treasury Bills (12mth)
US Dollar Index
[51 minutes] The difference between an ‘Early Warning System’ and a Decision Making System.
Early Warning System
The EWS narrows in on three key things.
Are the fundamentals improving or deteriorating?
What are well informed large institutional investors doing, buying or selling?
Are liquidity and capital flows strengthening or weakening?
Our system tracks these signals in a simple, easy to understand way so you can move forward with confidence.